
Soil and its acronyms
28/04/2021 - 00:00
Soil science is FULL of acronyms! We discuss 11 of them in detail in this blog article. From pH to pF, from CEC to HC. Nicely ordered, clearly explained and richely illustrated.
Let's start with a definition:
"An acronym is a pronounceable word formed from the first letter (or first few letters) of each word in a phrase or title. The newly combined letters create a new word that becomes a part of everyday language."
Soil science is FULL of acronyms! We'll discuss 11 of them, arranged in alphabetical order:
pH
pH is a measure of the acidity or basicity (alkalinity) of a soil.
The pH scale is logarithmic and inversely symbolizes the concentration of hydrogen ions (H+) in a solution. The pH scale ranges from 1 to 14.
- A pH of 7 is neutral. This means that the amount of hydrogen ions in the solution is equal to the amount of hydroxide ions (OH-). For example, water has a pH of 7 because when water breaks up, the split is equitable into one hydrogen ion for every hydroxide ion.
- A pH lower than 7 is acidic. The solution contains more hydrogen ions than hydroxide ions (H+ > OH-). Or put differently: if a molecule releases hydrogen ions in water, it is an acid. The more hydrogen ions it releases, the stronger the acid, and the lower the pH value.
- A pH higher than 7 is basic or alkaline. The solution contains more hydroxide ions than hydrogen ions (OH- > H+). These OH- ions will combine with H+ to create water (H20). Because hydrogen ions are used, the number of hydrogen ions in the solution decreases, making the solution less acidic and therefore more basic. So, the more hydroxide ions a molecule releases, the more basic it is.
The table below shows you the pH of some common substances and may help you to understand the pH scale.

The soil pH is very important for plant growth:
- Some plants prefer either acid or alkaline conditions. Most lawns and turf grasses for example, prefer a slightly acidic pH between 6.0 and 7.0.
- Certain diseases tend to thrive when the soil is either too alkaline or too acidic.
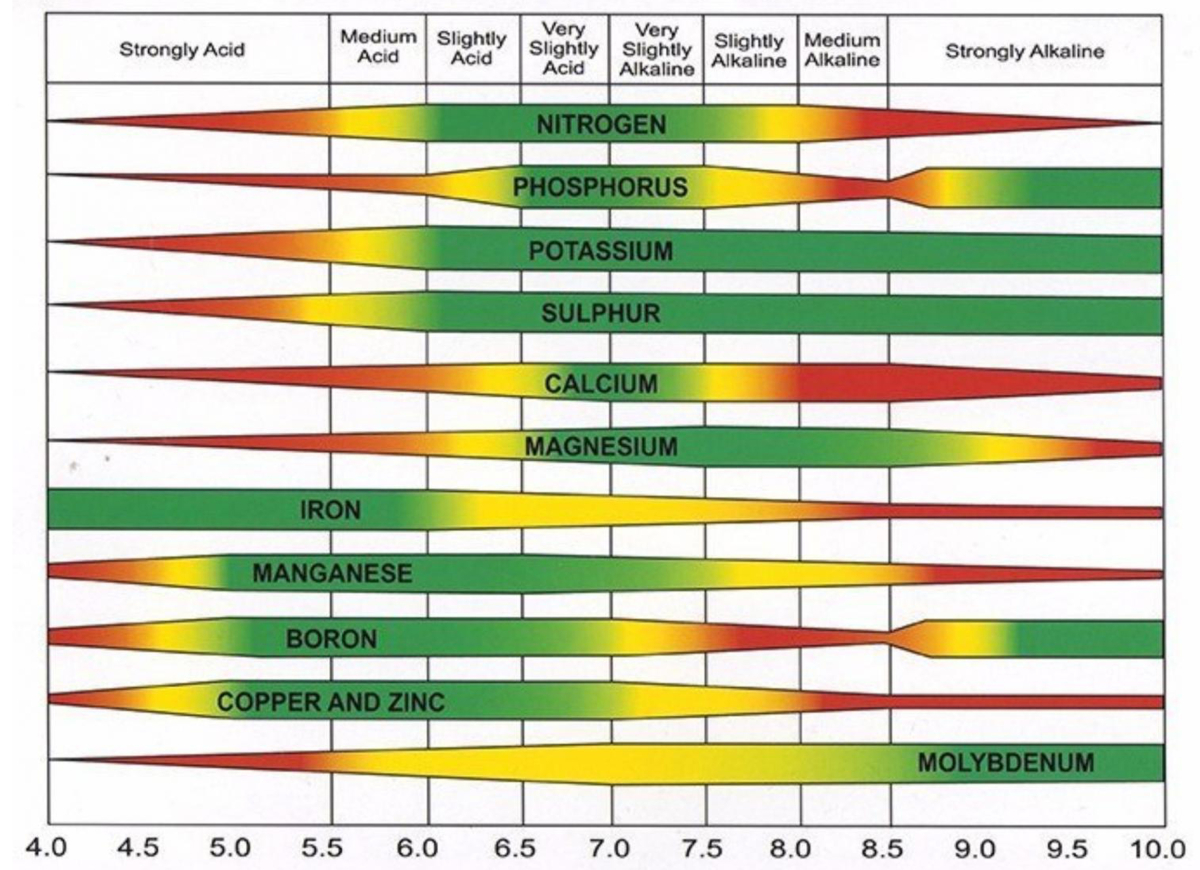
- The pH strongly affects the availability of nutrients in the soil.
The majority of food crops prefer a neutral or slightly acidic soil, because the solubility of most nutrients necessary for healthy plant growth is highest at pH 6.3-6.8. Some plants however prefer more acidic (e.g., potatoes, strawberries) or alkaline (brassicas) conditions.
When the pH drops below 5.5, most major plant-nutrient minerals (including nitrogen (N), phosphorus (P), potassium (K), sulphur (S), magnesium (Mg), and calcium (Ca)) and some micronutrients become insoluble and hence unavailable for uptake by plant roots:
- macro elements: these elements are needed in substantial quantities to promote healthy plant growth;
- microelements: these elements are important to plant growth in very small amounts
Many positively charged nutrients (cations, such as zinc (Zn2+), aluminium (Al3+), iron (Fe2+), copper (Cu2+), cobalt (Co2+), and manganese (Mn2+)) are soluble and available for uptake by plants below pH 5.0, although their availability can be excessive and thus toxic in more acidic conditions. In more alkaline conditions they are less available, and symptoms of nutrient deficiency may occur.
The table below visually illustrates how soil pH affects availability of plant nutrients
CEC
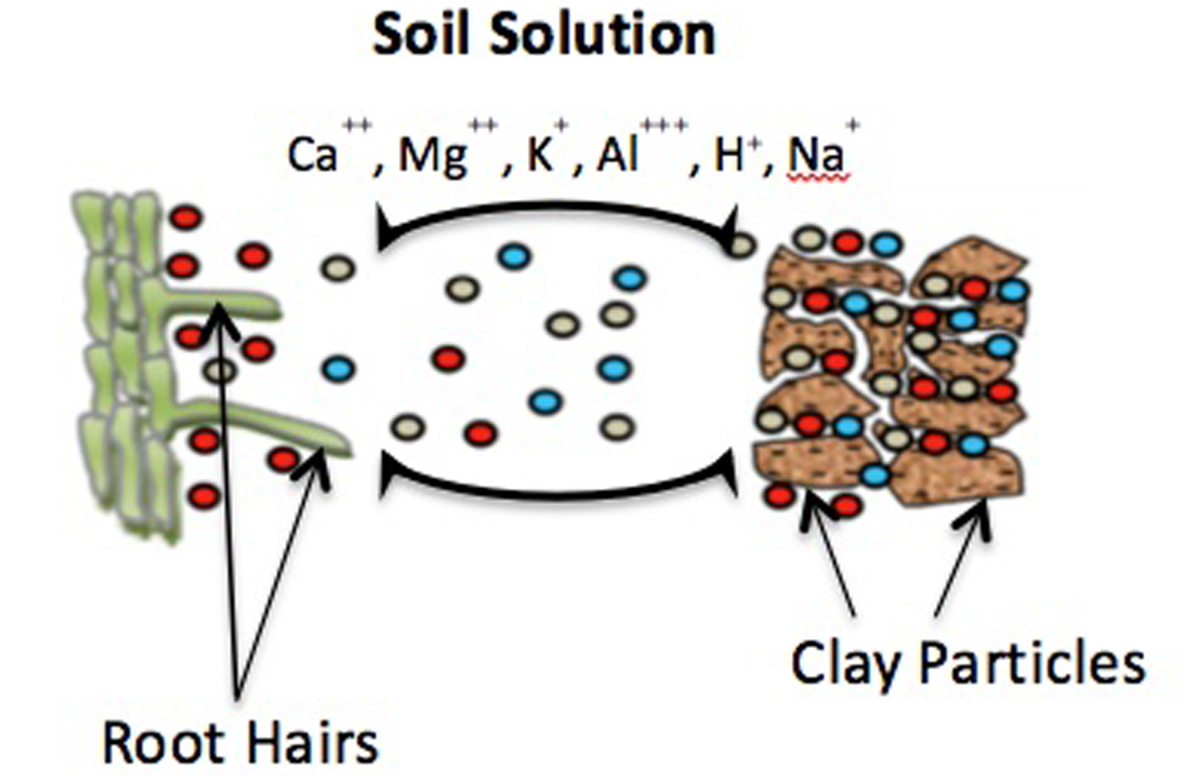
The CEC or Cation Exchange Capacity is the capacity of the soil to store exchangeable cations.
In a soil, clay mineral and organic matter components have negatively charged sites on their surfaces. Also plant roots have an overall negative charge.
Just like a magnet, these negatively charged sites will attract positively charged ions (cations) by electrostatic force. Some of these cations are critical for plant growth:
- magnesium (Mg2)+,
- potassium (K+),
- ammonium (NH4+) and
- calcium (Ca2+).
In general terms, soils with a high CEC are more fertile, because they can retain more of these cations. Cations in the soil compete with one another for a spot on the cation exchange capacity. However, some cations are attracted and held more strongly than other cations.
CEC is expressed in meq/100g. Soil CEC typically increases as clay content and organic matter increases.
| The relationship between soil texture and CEC | |
| Soil Texture | Typcial CEC (meq/100g soil) |
| Sand | 3-5 |
| Loam | 10-15 |
| Silt loam | 15-25 |
| Clay loam and clay | 20-50 |
| Organic soil | 50-100 |
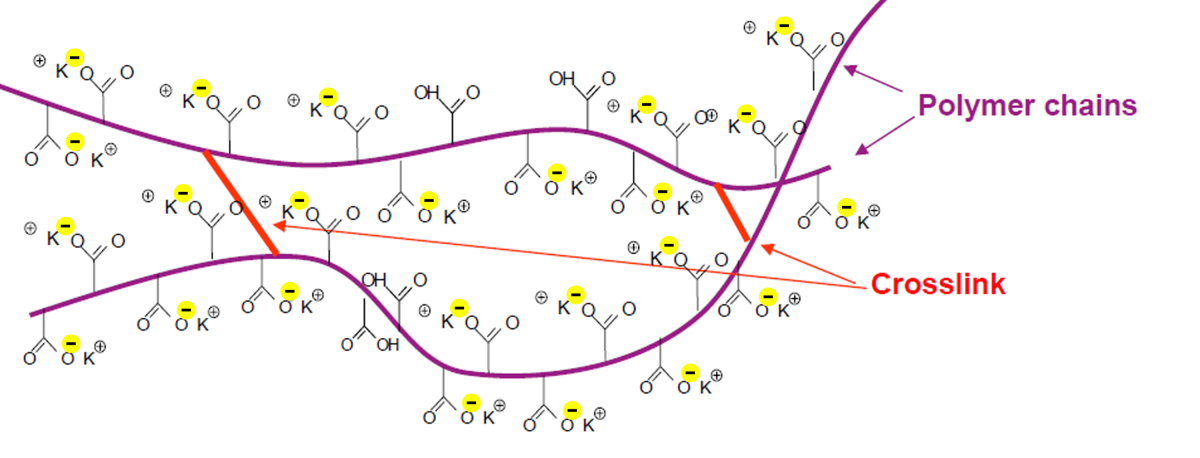
The CEC of a soil can be increased by mixing soil amendments with a high CEC. For example, the CEC value of TerraCottem exceeds 150 meq/100g. This is due to the high CEC of its carrier materials and especially its superabsorbant polymers. These are crosslinked polymer chains with lots of negative charged areas inside its chemical structure:
There is a direct relation between the pH and the CEC of a soil. The CEC is lowest at soil pH of 3.5 to 4.0 and increases as the pH is increased. Because CEC may vary considerably with soil pH, it is a common practice to measure a soil's CEC at a pH of 7.0. Remark (see figure below): at low pH, some positive charges may also occur on specific soil mineral surfaces. These may retain anions (negatively charged ions) such as chloride (Cl-) and sulphate (SO42-).
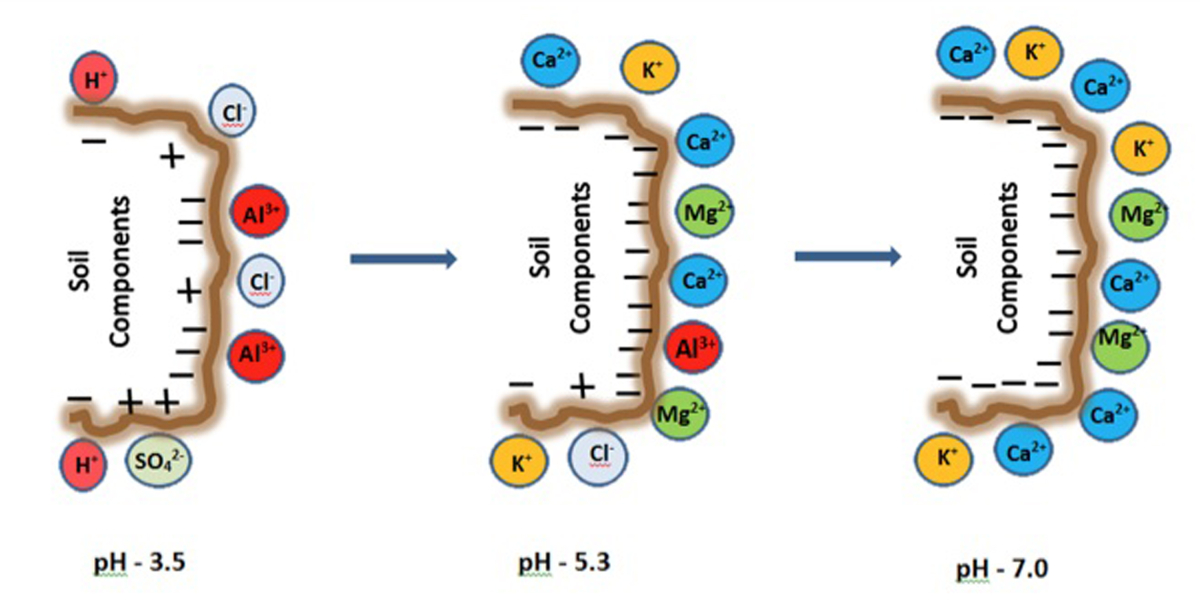
The soil cations can be divided into two groups:
- "Base cations": ammonium (NH4+), calcium (Ca2+), magnesium (Mg2+), potassium (K+), and sodium (Na+) (*)
- "Acid cations": aluminium (Al3+) and hydrogen (H+)
The words "base" and "acid" refer to the cation’s influence on soil pH. A soil with a lot of acid cations held by soil particles will have a low pH. On the other hand, a highly alkaline soil predominately consists of base cations.
(*) Unlike ammonium, calcium, magnesium and potassium, sodium is not an essential element for all plants. Soils that contain high levels of sodium can develop salinity and sodicity problems.
NPK
NPK is short for nitrogen (N), phosphorus (P) and potassium (K). These are followed by 3 numbers, for example 20-8-5 and represent the percentage of these components in the package.
More precisely:
- N is the percentage of elemental nitrogen by weight in the fertiliser;
- P is the percentage by weight of phosphorus pentoxide P2O5 in a fertiliser. P2O5 consists of 56.4% elemental oxygen and 43.6% elemental phosphorus by weight. Therefore, the elemental phosphorus percentage of a fertilizer is 0.436 times its P value.
- K is the percentage by weight of potassium oxide K2O. K2O consists of 17% oxygen and 83% elemental potassium by weight. Therefore, the elemental potassium percentage is 0.83 times the K value.
|
Remarks:
In the above example of 20-5-8, a 20kg bag of that fertiliser will contain 20% of nitrogen, 8% of phosphorus pentoxide and 5% of potassium oxide. Thus:
Two more examples:
|
"Up, Down, and All Around"

This is a good reminder of describing the purpose of each element:
- Up = nitrogen (N). Nitrogen helps the above ground plant growth. It is largely responsible for the green leafy growth of foliage and lush green lawns.
- For that reason, fertilisers used for the maintenance of lawns will frequently have a high first number, for example 20-5-8.
- Down = phosphorus (P). Phosphorus , the middle number, is largely responsible for root growth and flower and fruit development.
- For example, a fertiliser used for flower production will have a relative high middle number.
- The same is true for starter-type fertilisers for your lawn.
- All Around = potassium (K). Potassium is important for overall plant health. It helps build strong plants cells As a result, the plants will have a higher resistance against heat / cold, pests and diseases.
- For example, winterizer fertilisers will have a high component of potassium.
OM
Soil organic matter is made up of plant and animal residues in different stages of decomposition, cells of soil microorganisms, and many types of decomposed substances.
We can distinguish either "living" and "dead" organic matter:
- "Living": plant roots and soil animals. These provide organic materials to the soil that eventually become part of the soil organic matter cycle.
- "Dead", where we have 3 subgroups:
- Active soil organic matter:
- Primarily made up of fresh plant and animal residues that break down in a very short time, from a few weeks to a few years.
- It shows lots of biological activity.
- Passive soil organic matter or humus:
- This is not biologically active, meaning it provides very little food for soil organisms.
- It may take hundreds or even thousands of years to fully decompose.
- Slow soil organic matter is somewhere in between active and passive soil organic matter.
- It consists primarily of detritus, partially broken down cells and tissues that are only gradually decomposing.
- It may take a few years to a few decades to completely break down.
- Active soil organic matter:
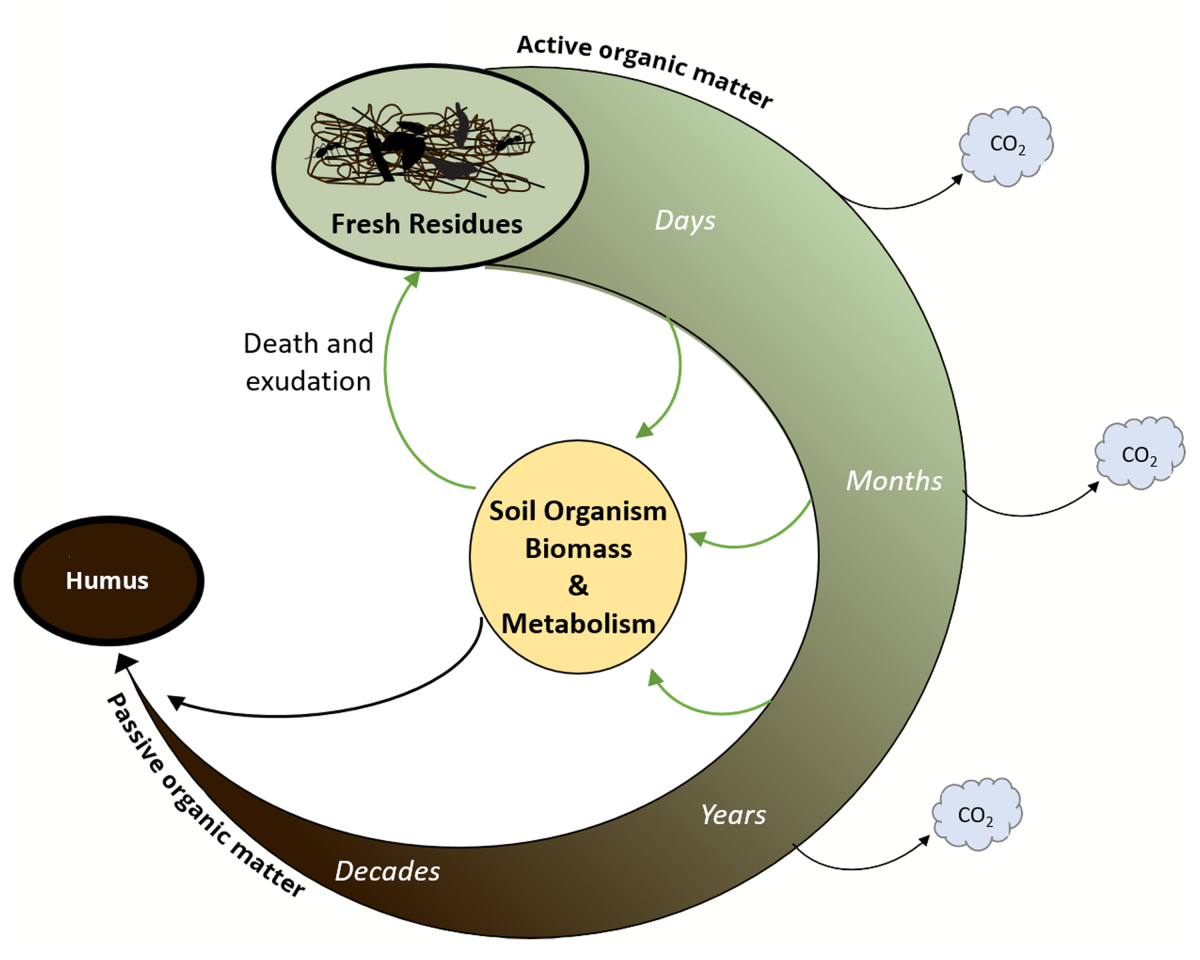
There are four main processes in the soil organic matter cycle, and all of them rely on soil microbes:
- decomposition of organic residues,
- release of nutrients (mineralization),
- release of carbon dioxide (respiration), and
- transfer of carbon from one soil organic matter ‘pool’ to another.
Humus is thus the "end product" of decomposition of organic matter. It gives the soil its dark brown colour. Usually, humus represents the majority of total soil organic matter.
Humus consists of:
- Humic Acids
- Fulvic Acids
- Humin
|
Compost is not humus! Compost is plant material that is slightly decomposed. Even aged, well-rotted compost is still only slightly decomposed. Once added to your garden compost will continue to decompose for several years. |
| C:N Ratio |
|---|
|
This is the carbon-to-nitrogen ratio of organic matter. There is always more carbon than nitrogen in organic matter. For example, a ratio of 20:1 means that there is 20g of carbon for each 1g of nitrogen in that organic matter. The lower the C:N ratio, the more rapidly nitrogen will be released into the soil for immediate crop use.
|
Most soil organic matter comes from plant tissue:
- This plant tissue consists largely of water: 60-90%.
- The remaining dry matter consists of carbon (C), oxygen, hydrogen and small amounts of sulphur (S), nitrogen (N), phosphorus (P), potassium (K), calcium (Ca) and magnesium (Mg). These nutrients are very important for plant growth.
This brings us directly to the benefits of organic matter:
- Provides nutrients. These nutrients become available as the organic matter is decomposed by microorganisms. Because it takes time for this breakdown to occur, organic matter provides a slow release form of nutrients.
- Improves soil structure. As organic matter decays into humus, the humus molecules 'cement' particles of sand, silt, clay and organic matter into aggregates which will not break down in water. This cementing effect, together with the weaving and binding effect of roots and the mycelium of fungi gives the soil 'structure".
- Improves drainage. These larger, stable aggregates have larger spaces between them, allowing air and water to pass through the soil more easily. (*)
- Holds moisture. These aggregates can also retain relatively large amounts water increasing the soil's water retention capacity.
- Improves cation exchange capacity. Humus has an enormous surface area, which is negatively charged. This means it can attract and hold huge quantities of cations (positively charged ions) such as magnesium (Mg2)+, potassium (K+), ammonium (NH4+) and calcium (Ca2+) until the plant needs them. Clays also have this capacity, but humus has a much higher CEC than clays.
|
(*) Remark: the amount of organic matter in the top layer is a much debated subject in the sports turf industry. On sand-based fields OM can rapidly accumulate around the base of the grass plants. A "thatch" layer is formed that compromises the drainage capacity. Thatch build-up can be caused by several factors, amongst which the relatively low microbiological activity in such soil profiles and over-application of nitrogen fertilisers. Adequate maintenance is needed to maintain the organic matter within the preferred ranges. |
WRC / WHC
Water retention capacity (WRC) or water holding capacity (WHC) is the ability of a soil to physically hold water.
It is commonly expressed as v/v (percent of volume) either w/w (percent of weight).
WRC is primarily controlled by:
- soil texture and
- organic matter.
Soils with smaller particles (silt and clay) have a larger surface area than those with larger particles (sand). A larger surface area allows a soil to hold more water. Based upon the percentage of sand, silt and clay in a soil, we can distinguish 12 soil texture categories. This is visually represented in a soil texture triangle.
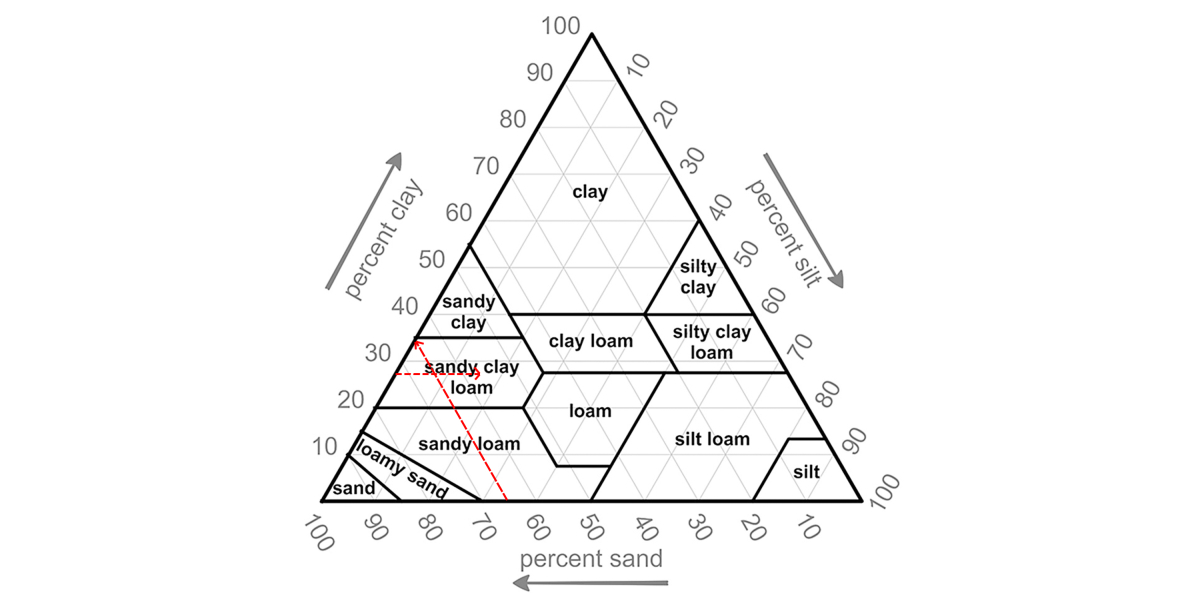
|
Example: imagine a soil sample with 65% of sand, 27% of clay and 8% of silt. |
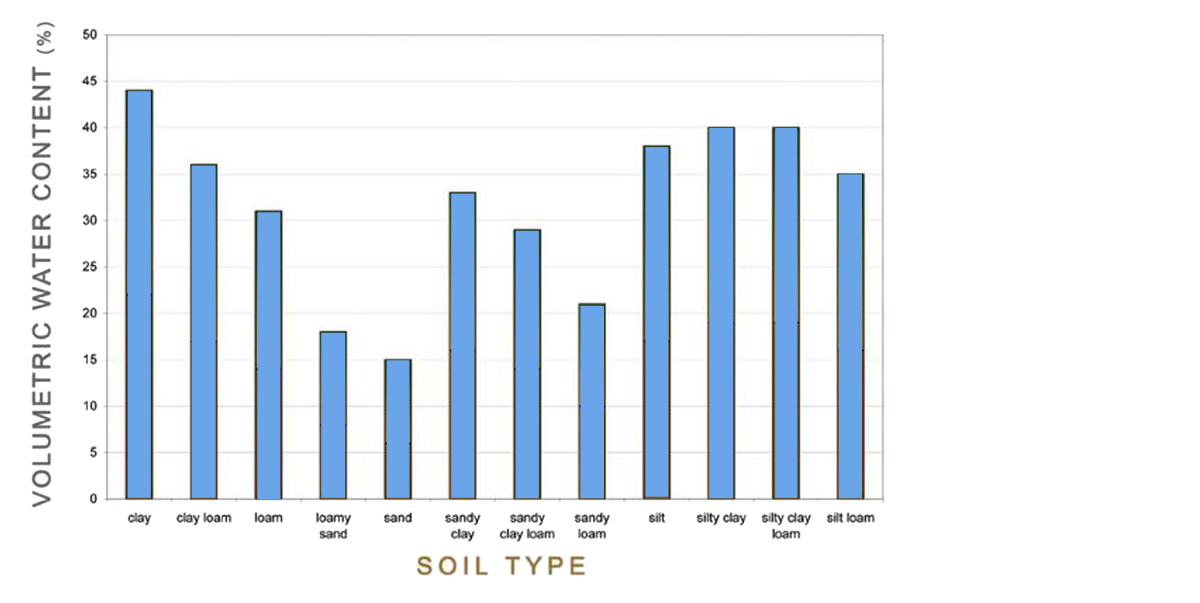
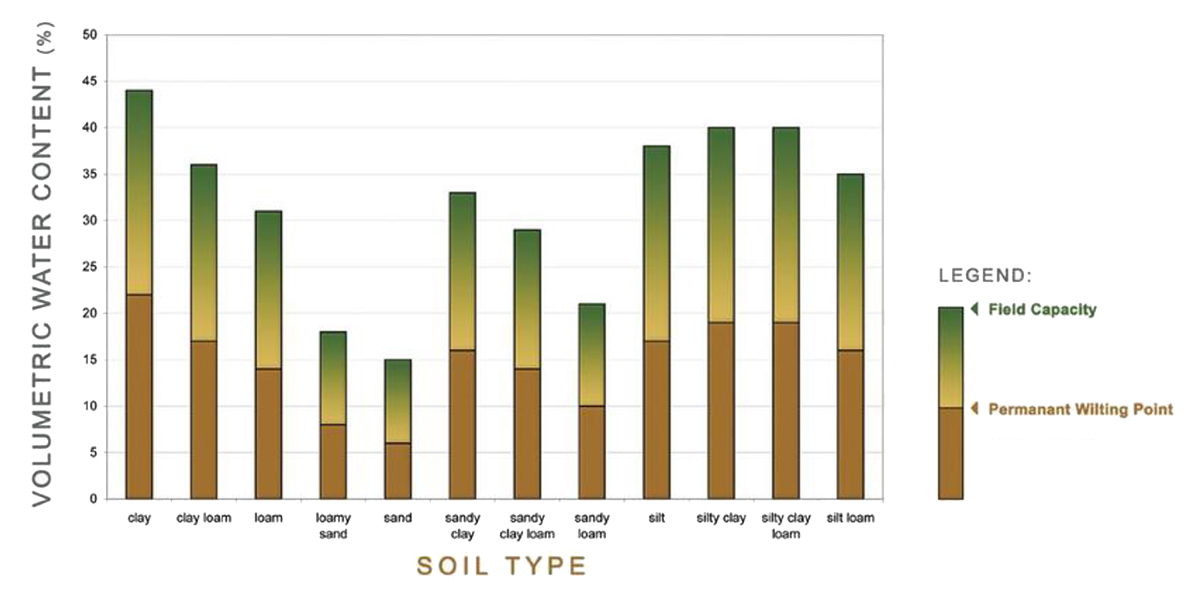
These 12 soil types have a different water holding capacity:
pF
The relation between the volumetric water content in your soil and the water potential (i.e. the suction force applied to that water) is expressed in a water retention curve or pF - curve.
The name pF is short for "Potenz" (or "exponentiation") and "Freier energie" (or "available energy").
- On the X-axis the volumetric percentage of water is plotted;
- On the Y-axis the logarithm of the suction force, expressed in centimetres "water head".
| A drainpipe at a depth of 100 centimetres for example, will excert a suction force of 100cm or pF2. |
Watch the following video: the sponge in the video represents the soil matrix:
As the water retention capacity primarily is controlled by soil texture (and organic matter), the shape of the pF-curve changes with soil texture. A common shape for a clay, silt and loam soil is:
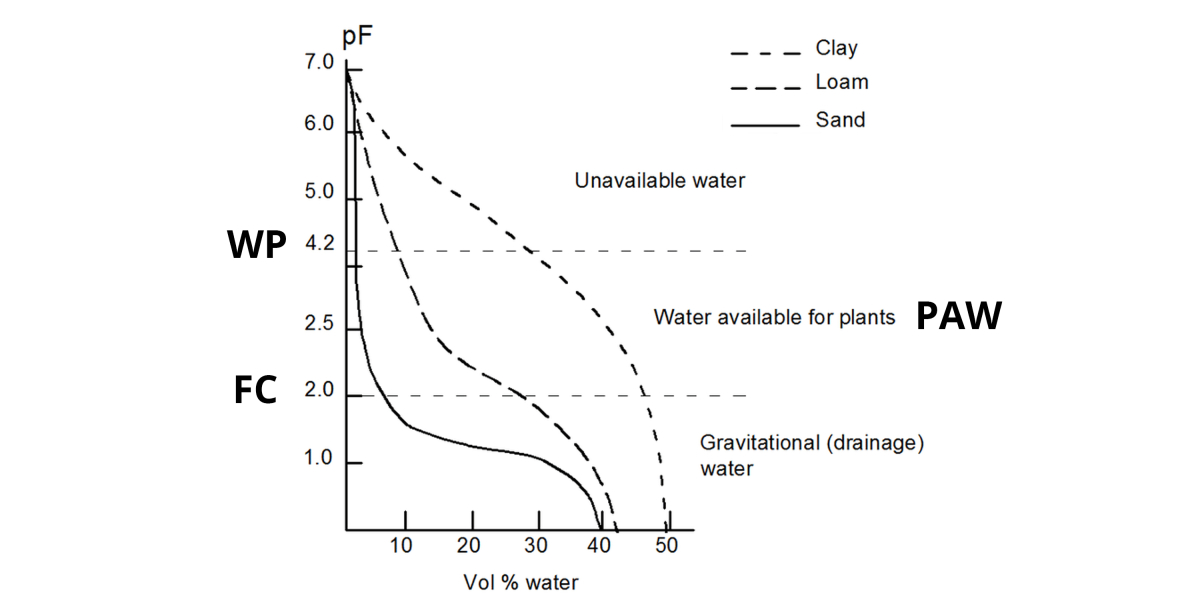
- A saturated soil has a pF close to 0.
- Due to gravity water will drain from the biggest pores, until an equilibrium is reached at +/- pF2. This is called Field Capacity (FC).
- When plants absorb water, more water is removed from the soil: the pF increases. When pF4.2 is reached, the remaining water is no longer available for the plants. This is called Wilting Point (WP).
- The amount of Plant Available Water (PAW) is situated between pF2 and pF4.2.
- An oven-dried soil sample has pF7: no more water is left.
The amount of Plant Available Water (PAW) in a clay soil is much higher than in a sandy soil:
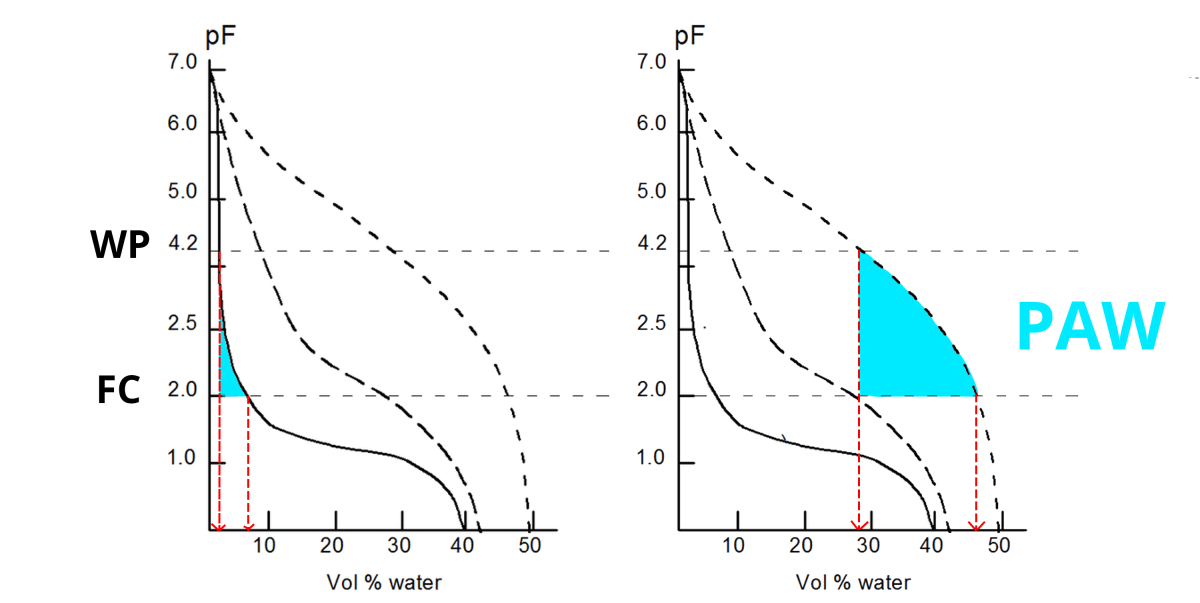
| At FC, the volumetric water content in this sandy soil is +/- 8%; at WP merely 2%. This gives 8-2 = 6% PAW in a sandy soil. In this clay soil, the volumetric water content is +/- 47%; at WP +/- 28%. This gives 47-28 = 19% PAW. |
This also is the reason why a clay soil with 20% of water will feel dry and a sandy soil with 10% of sand will feel humid. The WRC of soils can be increased by adding soil amendments suited for that purpose.
To conclude:
- the total Water Holding Capacity WHC is not directly related to the amount of water available for the plants.
- the amount of Plant Available Water PAW is the volume of water that remains in the soil after free drainage minus the volume of water that is too strongly bound to the soil matrix.
The following figure gives a good overview of the PAW in relation to the 12 soil types:
EC
Soil Electrical Conductivity (EC) is a measure of the amount of salts in soil (salinity of soil).
Soil electrical conductivity gives us an indication about the total amount of salts, not the presence of specific salts.
It is an important indicator of soil health. It has an impact on:
- crop yields,
- crop suitability,
- plant nutrient availability and
- soil microbiological activity.
A too high EC will disrupt the soil water balance and hinder plant growth.
Soils with high salt contents occur naturally in arid and semiarid climates. However, salt levels can increase as a result of cropping, irrigation, land use and application of fertiliser and compost.
|
Some examples:
|
Soil electrical conductivity is expressed in μS/cm (or mS/cm), dS/m or ppm:
- 1 dS/m = 1000 μS/cm (= 1 mS/cm) = 640 ppm (when EC < 5 dS/m);
- 1 dS/m = 800 ppm (when EC > 5 dS/m);
Both the soil texture and CEC have an effect on EC:
- Soils that have a higher content of smaller soil particles (higher content of clay) conduct more electrical current than do soils that have a higher content of larger silt and sand particles (lower content of clay).
- Soils that consist dominantly of clay minerals that have a high cation-exchange capacity (CEC), can have higher EC than soils that consist dominantly of clay minerals that have a low CEC.
Based upon the EC value, a classification can be made for the degree of salinity:
| ECe method (dS/m) (*) | ||||
| Non saline |
Slightly saline |
Moderately saline |
Strongly saline |
Very strongly saline |
| 0 - 2 | 2 - 4 | 4 - 8 | 8 - 16 | > 16 |
| (*) There are different methods to determine the EC: ECe (on a saturated soil paste extract), EC1:1 (on a mixture of soil over water mass ratio of 1:1), EC1:5 (on a mixture of soil over water mass ratio of 1:5), ... | ||||
The salt tolerance of a plant is the maximum salt level that plant can tolerates without losing its productivity or inhibiting growth:
- For example, the FAO has an extensive list of crop salt tolerance;
- Similar lists exist for landscaping plants;
HC
Soil hydraulic conductivity is the ability of a soil to transmit water, under saturated or nearly saturated conditions.
The hydraulic conductivity is a flow rate and hence expressed in a volume of water per unit of time.
Sometimes the hydraulic conductivity is equated to the infiltration rate, but from a scientific point of view this is not quite true:
- The hydraulic conductivity is a property of the soil and can vary according to the level of saturation:
- hydraulic conductivity in the unsaturated zone is not the same as the saturated hydraulic conductivity (Ks) in the saturated zone;
- The infiltration rate is the inflow into the soil: how fast is water entering the soil.
- However, just talking about infiltration rate might not be helpful. Imagine a small rain shower, sort of a drizzle. A lot of soils can soak that water in, no problem, giving an infiltration rate that is equal to rainfall rate. So instead, it is better to talk about infiltration capacity: the maximum rate at which water can enter a soil.
The infiltration capacity changes over the course of a rain storm (or irrigation event), so you can’t just measure infiltration capacity at any random point of time. Initial infiltration rate is high, but afterward it decreases. Finally it becomes constant. That steady-state rate is approximately equal to the saturated hydraulic conductivity. And it’s that steady state rate that we most often want to measure.
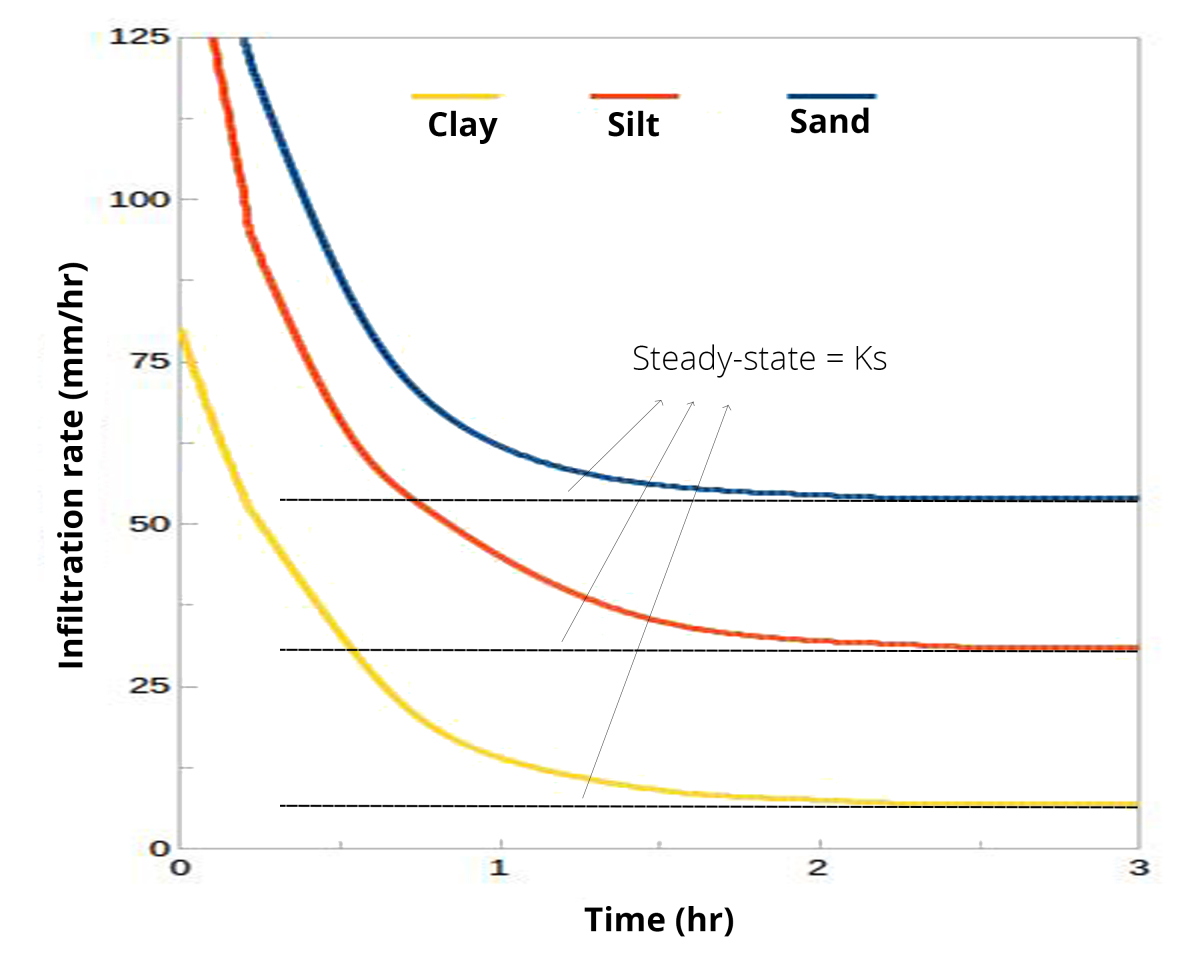
The saturated hydraulic conductivity Ks is expressed in mm/hr or cm/hr and is strongly related to soil texture and structure:
- Water moves more quickly through the large pores in sandy soil than it does through the small pores in clayey soil.
- When the soil is compacted and has little or no structure, the Ks will be even lower.
- Depending on the amount and type of clay minerals, some clayey soils develop cracks from shrinkage as they become dry. The cracks are direct conduits for water to enter the soils. Thus, clayey soils can have a high infiltration rate when dry and a slow rate when moist (cracks close).
Management practices that improve soil organic matter content, soil aggregation, and porosity can also improve infiltration.
| Measuring saturated hydraulic conductivity Ks | |
|---|---|
|
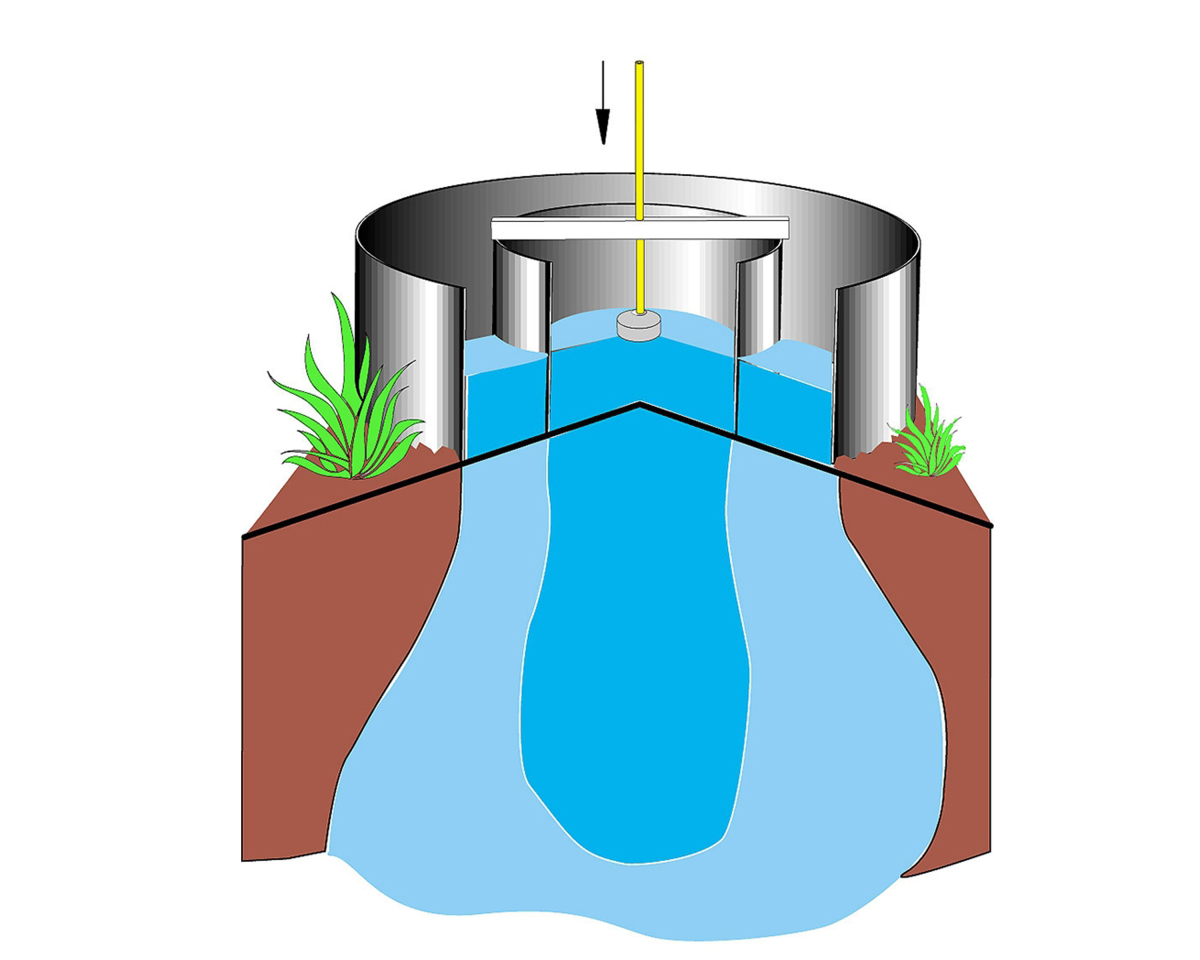
The most common way to measure saturated hydraulic conductivity Ks in the field is using a "double ring infiltrometer". Two concentric rings are pounded slightly into the soil and filled with water. The water from the outer ring helps wet the soil and infiltrates both vertically and laterally into the dry soil. The infiltration rate is measured in the inner ring, where infiltration and percolation are happening only vertically, thanks to the water from the outer ring. Tests can be conducted in two ways: falling head and constant head. In a falling head test, water is added to the rings and the water level declines over time as infiltration occurs. In constant head tests, a device called a Mariotte bottle is added to the infiltrometer, which releases water so that a constant level (or head) is maintained inside the rings. |
 |
The video below shows a falling head double ring infiltrometer test:
Depending on the speed of infiltration, the following classification can be made:
| Rates (mm/hr) | Classification | Soil type |
|---|---|---|
| > 20 | High | Sands |
| 10 - 20 | Medium | Sandy and silty soils |
| 5 - 10 | Moderate | Loams |
| 1 - 5 | Low | Clay soils |
| < 1 | Very low | Sodic clay soils |
Importance of infiltration capacity
- When the infiltration is too slow, ponding can occur, surface run-off and soil erosion.
- When the infiltration rate is too high, leaching of nutrients can take place.
Best management practices are needed to improve soil infiltration:
- Sports pitches ideally are sand-based to have a high infiltration and drainage rate allowing training practice and games to be played even during high rainfall.
- In agriculture, tillage needs to be done wisely as it can break up soil structure and cause compaction. Keeping the soil covered with cover crops will reduce the direct impact of raindrops and limit crust formation and soil erosion.
If you know someone who would also like to read this article, feel free to share:
This blog article is inspired by the whitepaper "Soil And Its Acronyms" by Natham Straume (StrataGreen, Australia) and Davy Ottevaere (TerraCottem BV, Belgium).